Resonance in a Driven RLC Circuit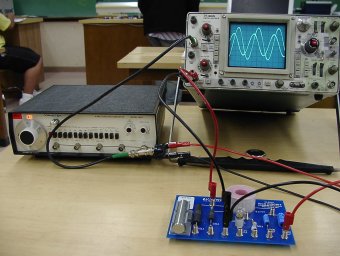 In the past few weeks in lecture several circuits have been discussed. In a circuit consisting of an inductor and a capacitor (LC), the energy will oscillate between the two elements, first stored in the magnetic field of the inductor and then in the electric field of the capacitor. A more realistic circuit (RLC) includes the effects of resistance, in which case the stored energy decreases as some goes to resistive heating. The formulae for voltages and currents in RLC circuits combines a sinusoidal function and a damped exponential. The circuit we will look at today has an AC power supply adding energy into the circuit. Conceptually we can think of a child on a swing. In an adult pushes the child at the proper frequency, the child will go higher and higher. If the adult does a bad job of pushing (meaning pushing at the wrong times), the child's motion will not be helped by the pushing. The best timing for pushing would match the natural frequency of the swing, as determined by the length of the swing and gravity. In terms of an electrical circuit, we can write down the formula for the voltage drop around a series circuit: Vtotal = VL + VR + VC, Where VL is the voltage across the inductor, VR is the voltage across the resistor and VC is the voltage across the capacitor. Since Vtotal must be equal to the input voltage, we can write: V Sin(wt) = L dI/dt + RI + q/C Or: V Sin(wt) = L d2q/dt2 + R dq/dt + q/C. The formulae that satisfy this second-order differential equation are given in figure 1.
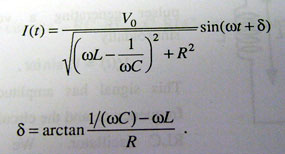
Figure 1 - Formulae for Driven RLC Circuit The normal approach to solving the differential equation is to use the phasor diagram approach. Phasors relate the voltage across a circuit element to the current flowing through it. Resistors have current and voltage in phase, in inductors the phase of the voltage leads the current by π/2 and in capacitors the phase of the voltage lags the current by π/2. The current through the circuit is maximized when the angular frequency is equal to (LC)-0.5. This is known as the "resonant frequency". As we move away from the resonant frequency, the response of the circuit will drop off. We will probe an RLC circuit with different frequencies and establish a response curve. The width of the peak around the resonant frequency is measured by "Q", the quality of the circuit. Mathematically, Q = ωo L /R where ωo is the resonant frequency. Experimentally Q = ωo / (ω2 - ω1), where ω2 and ω1 are the frequencies where the power in the circuit is 1/2 its peak value. Since power is related to the square of the current, and since current is proportional to the voltage in the resistor, if ωo is the peak frequency then ω1 and ω2 are the frequencies to either side where the voltage through the resistor is .707 of the peak value,
Procedure: The next step is to wire up the RCL circuit. Use the inductor on the RLC board and wire it in series with a capacitor. Complete the circuit by wiring a resistor in series. See figure 2. Have the instructor inspect your circuit before turning on the power. You will be using an 8.2 mH inductor in this lab. Your choices for a resistor are 10Ω, 33Ω and 100Ω and for a capacitor 100μF and 330μF. Before you come to lab, determine good values for C and R to give a resonant frequency that you can generate with your function generator, and a peak narrow enough to measure. Draw phasor diagrams of your proposed circuit in your notebook at ωo, ω1 and ω2 with as much detail as possible.
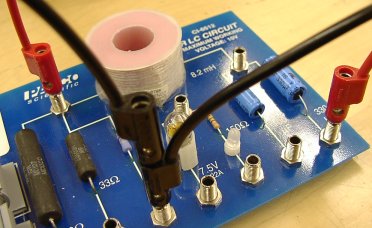
Figure 2 - Close view of wiring Measure the voltage across the resistor on channel two of your oscilloscope. Via Ohm's Law this gives the current through the circuit. If you view both channels you should see a screen like that in figure 3.
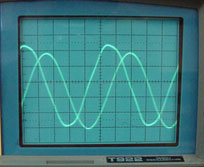
Figure 3 - Oscilloscope with driving voltage and voltage across resistor Do not take voltage data in your notebook, plot the resonance curve of the RLC circuit. You will have to use a log scale for your frequency. Bring the following graph paper to lab (points off if you wait until lab to print it). If you don't know how to use semilog paper, see the following primer. Note that in our lab the independent variable is the frequency, which will cover several decades. Hence the log scale will be along the x-axis. The sharpness of the peak is measured by a value known as "Q". What is your measured value of Q? Does it correspond to the theoretical value of Q = ωo L/R? Comment on the relative phase of the driving voltage and current through the circuit as a function of frequency. Can you think of a non-mathematical explanation of the behavior? |