Low Pass and High Pass FiltersIn this week's lab we'll look at the frequency behavior of series RC and RL circuits. We've observed both of these before, but that was with a pseudo-DC signal (we used a square wave with a period that was much greater than the time constant for the circuit to simulate the opening and closing of a switch). In this case we'll send a sine wave through the circuit and measure the output voltage.
Theory At high frequency an inductor will experience high voltages, while a capacitor won't have enough time to build up charge on its plates before the direction of the current switches. So a capacitor will have almost no voltage across it at high frequencies, but will follow the power supply at low frequencies. What this means is that if we monitor the voltage across the capacitor it will closely match the power supply for low-frequency signals, but will drastically drop for high frequency signals. The inductor will have the opposite behavior.
With a knowlege of reactances we can address these circuits.
Electrical engineers make use of this behavior to use this circuit to filter signals. A voltage signal with a low frequency will be mirrored by the voltage across the capacitor, while a high frequency signal will be ignored by the capacitor.
Engineers and physicists use slightly different languages. For example, since the engineers
really want to use i for current, they use the letter j for the square root of minus one
(somehow physicists don't get them confused... or at least not often). Engineers also like
using ordinary frequency (f) instead of angular frequency (ω), and will compare their voltages
in decibels. The gain of a network in decibels is given as: Engineers are also very interested in where the voltage ratio has dropped to 1/(2)1/2. This is because the power goes as the voltage squared, so this is the "half-power" point. This occurs at the "corner frequency" (fc = 1 / (2 π τ). The corner frequency can be discovered graphically. Observe the chart below. The log of the frequency is graphed on the x-axis and the gain on the y-axis. The response in both the high and low frequency regions are straight lines. It can be shown that the intersection of these two lines occurs at the corner frequency.
The mathematics for an RL series circuit are similar, only with the result that signals at
high frequencies are passed and low frequencies are blocked.
RC Low Pass Filter Collect voltage as a function of frequency. The values of frequency should vary over a wide range. Start with 10 hertz and then move to 20, 30, 50 and 70. Use the same increments for higher powers of ten, from the 100s to the high 10,000s. A few minutes playing with the features of your oscilloscope at the start of this experiment will make your measurements much easier in the long run. Since the frequency is over such a wide range, plot the log of the frequency (in Excel, or if you want to go old school, use semilog graph paper). On the y axis graph the gain. Extend straight lines from the two regions to establish the corner frequency. How does it compare to the predicted corner frequency? Does the value of Vout/Vin match up with what you expected?
Repeat this experiment with a second capacitor.
LR High Pass Filter Understanding Semilog Paper In the next graphic we've put numbers on top of the chart. The reason that the chart looks irregular is that the x-axis is based upon logs, which allows us to put many orders of magnitude along this dimension. Note that the first set of numbers goes as 1,2,3... the second as 10, 20, 30... and the next as 100, 200, 300... It's fairly easy to get this confused, print out a piece of semilog paper and write in your own numbers as practice. 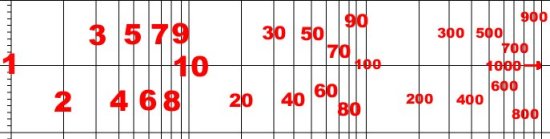
Why are the vertical lines spaced as they are? This comes down to how logs are calculated. We need to remember that if y = log(x), then x = 10y. We also need to remember that multiplication is addition when it comes to logs, in other words, if y1 = log(x1) and y2 = log(x2) then if x3 = x1 * x2, then y3 = y1 + y2. Also, log(xy) = y log(x) (with a little reflection, this should be obvious from the previous rule)
All that is left is to calculate the logs of the two through ten. Here's the way my father, an old-school engineer, approaches this
exercise:
So to make semilog paper, my father would put the number 1 at zero, 2 at 0.3, 3 at 0.475 and so on. For 10 he would put a mark at 1, for 20 a mark at 1.3, you should be able to fill in the rest. He would have a fairly good approximation for semilog paper, without ever using a calculator. Of course, if he wanted a perfect copy of semilog paper, he would use his slide-rule. |