Planck's Constant and the Photoelectric Effect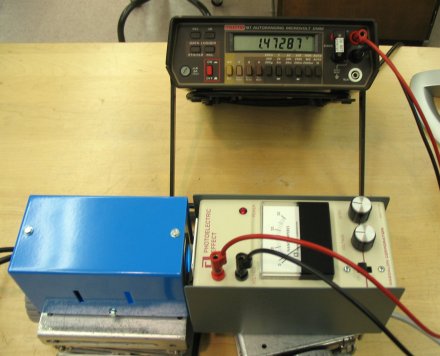
The photoelectric effect experiment is at the heart of early quantum mechanics, and its proper explanation won Einstein his Nobel Prize. Heinrich Hertz helped to confirm one of the great scientific discoveries of classical physics. His production and detection of radio waves served as experimental proof of Maxwell's equations. Another of his discoveries helped to overthrow our classical view of the world. Hertz noted light changed the electrical properties of metal. In the simplest picture, light falling on a clean metal surface causes electrons to be emitted. The more intensity that falls upon the metal, the more electrons. This is usually measured as a current. However, there were a few things that scientists could not explain with the classical model. One of them was the fact that there was a frequency dependence. At constant intensity the current would not flow if the wavelength of the light was too long. This cutoff wavelength was dependent upon the material being tested.Einstein's solution to this problem involved using Planck's equation E=hf. He proposed that light was made up of small packets called photons, each containing an energy determined by Planck's equation. Einstein claimed that the cutoff wavelength represented the "work function" - the amount of energy it took to free an electron from the metal. Einstein's solution explained another aspect of the photoelectric effect - each photon would eject an electron with a given maximum kinetic energy. A reverse voltage would defeat that kinetic energy. This was known as a "stopping" or "retarding" potential. The work function plus the stopping potential multiplied by the charge on the electron would equal the energy of the original photon. A simulation of the original photoelectric effect experiment can be downloaded here. It is suggested that you give it a test-drive before lab.
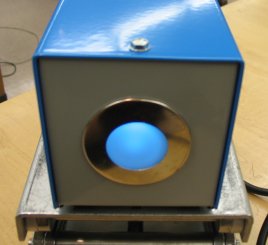
Light filters are used to control the wavelength of light falling upon the phototube from the light source. Since the light source is a mercury lamp, we can use the known wavelengths of mercury as a guide. In the visible this means that the blue filter will allow the 405nm line, green the 546nm line and with no filters you can observe the 365nm UV line. Using the appropriate filters on the photobox, use the green and red lasers for the 532nm and 633nm lines. Note that when using a laser a diffuser will be needed to spread out the light to make an effective measurement. We are using Mercury lamps today. Do not stare into the lamps, as they can damage your eyes with their UV photons. Needless to say, don't stare at the lasers either! Also note that it is good practice to let the mercury lamps to stabilize for about fifteen minutes before taking data. Since stray light will strongly affect the results, make sure that the equipment is well shielded and that the filters are properly placed. It's a wise precaution to turn off the screen on your computer. With each set of filters, record the wavelength and the potential needed to drop the photocurrent to zero. This can be a very hard measurement to perform. First the meter needs to be zeroed. Take the stopping potential knob and rotate it completely clockwise. This will prevent any photoelectrons from forming a current, and hence the meter should read zero. Use the zero-adjust knob to set the needle to zero on the meter. You may need to do this before every measurement. Take voltage data five times at each wavelength for your plot. The mercury lamp has different intensities at different wavelengths, and this is reflected in the currents for each color. Note which data points are based upon small currents, keep this in mind for the next step. Invert the wavelength in order to get a number proportional to the frequency. Plot this on the x-axis and the stopping potential on the y-axis. A linear best-fit line will give information about Planck's constant and the work function via the slope and the intercept. Since your data are measured in eV and in nm, what should the slope of the line on your graph should be? You should know this number before you come to lab. Write up a preliminary report of your findings to incorporate into a larger lab report due the week after part two of this lab.
WEEK TWO In theory, we can use Schrodinger's equation, the electrostatic potential, and the proper boundary conditions to solve for the energy levels in an atom. However, materials are not made up of single atoms, but by atoms in bulk. How do we need to modify our picture when dealing with many many atoms? In a material there will be a large number of energy levels available for the electrons to occupy. These group into "bands" of very-closely spaced energy levels. On a macroscopic level, an insulator is a material that will not conduct electricity, whereas a conductor will allow a current to flow. From a quantum-mechanical viewpoint, the difference between an insulator and a conductor comes down to their respective band structures and how they are populated by electrons. In any electronic band structure there are spacings between the bands known as energy gaps. In an insulator, the electrons in the material fill up the band all the way to the gap. If an electron moved across a material, it would have more energy in the form of kinetic energy. If the band is filled to the top, the electron cannot gain this kinetic energy unless it has enough energy to "jump" into the next band (for reference these are known as the valence and conduction bands). In a conductor the electrons do not fill the band, so it is easy for them to gain the kinetic energy and flow as part of a current. A semiconductor is a special case. In a semiconductor the energy gap is small, allowing electrons to possibly flow if they can gain a small amount of energy. An LED is constructed in such a way that it requires a voltage of a few volts to get a current to flow. This corresponds to an energy gap of a few electron volts. When we apply less than this critical voltage to the LED, no current will flow. However, when we supply more than this voltage, the current will flow and the LED will emit photons with at frequency related to the energy gap. For technical applications, semiconductors are usually "doped", meaning that impurities have been added to change their electronic structure. When an atom that has one more electron than the others in the material is used as a dopant, this results in an extra atom in the conduction band. This is called an n-type semiconductor because a negative charge carrier has been added. Of course, an atom with one fewer electrons can also be introduced. This results in a "hole", in essence the lack of the electron can also act as a charge carrier, in this case a positive one, hence the name p-type. When a p-type semiconductor is joined to an n-type, the extra electrons move from the n-side to the p-side, filling the holes. This movement of electrons will happen only in the depletion region, a small area where the two types meet. As the electrons leave the n-side, this leaves positive ions, and negative ions are created on the p-side of the junction. This creates an electric field in the depletion region. Unless an outside voltage is applied, electrons cannot overcome this electric field and current will not flow. If a large enough voltage is applied, it can overcome the internal electric field and a current can be created. In a light-emitting diode the electric field is on the order of a few electron volts. Hence a few volts will create a current. However, the electrons will later give up this extra energy in the form of light. Both the voltage needed to flow the current and the light can be measured in lab.
Like last week, we will have to
generate a graph with wavelength (frequency) and voltage information. We will use
data studio to take current vs. voltage measurements in order to assign a proper voltage
to each of the LEDs. Set up a circuit with a resistor, an LED and the computer-controlled
power supply. In the software, set the voltage of the circuit to ramp from zero to five volts
at low frequency. You can then measure the voltage across the resistor to plot the current vs. voltage behavior
of the LED. You will find no current will flow, and then the current will react in a
linear manner. Fit a plot of the linear region in order to find the intercept where the voltage
first "turns on" the current. This is called the "knee voltage" and will be the critical voltage for your LED.
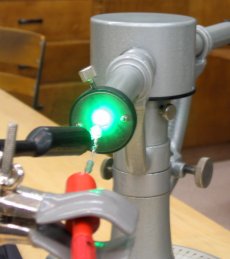
Note that these are high intensity LEDs, and they can harm your eyes if you stare at them at
high voltage. 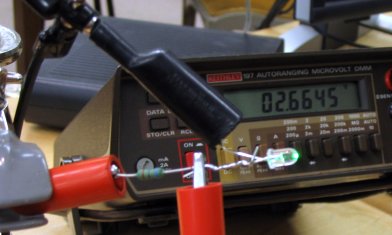
The setup for measuring the critical voltage across an LED
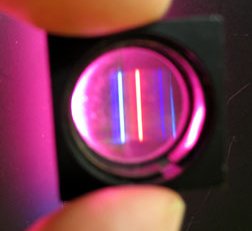
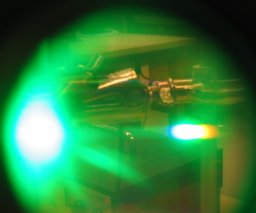
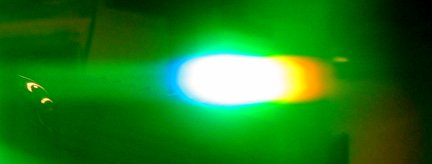
In the atomic spectra lab we can see diffraction lines due to the specific energy levels in the atoms. Since semiconductors have a band structure, we don't see lines, we see streaks. The diffraction photographs below show in detail the difference between the two results. Find the angle matching the color of the LED and record it. Using n λ = d Sin θ establish the wavelength for each LED. The value of d will be given in lab.
Once again, plot voltage against inverse wavelength to get a value of Planck's constant. For the following week you should write a lab report detailing your results in these two experiments. Compare and contrast the methods and discuss how close each got to Planck's constant. | |||||
 Assemble the diffraction instrument as in