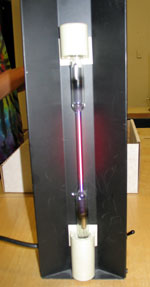
Atomic SpectraWarning #1 - We use a high voltage in this lab to excite atomic transitions. Touching the tubes while they are activated is a very bad idea. Warning #2 - The tubes get very hot, let them cool for a minute before you handle them. Warning #3 - The oils from your skin can affect and weaken the hot glass tubes, for this reason only handle the gas tubes with cloth or tissue. People who work on their own cars will note that the same applies to headlamps. Summary of warnings - Never touch the gas tubes with bare skin, let them cool before removing them, and never make contact when they are at high voltage. This experiment is perfect for Physics 4D as it deals with many topics from our class. We take tubes that contain different gases and raise them to high voltage. This excites the electrons in the gas molecules and creates atomic transitions between the energy levels in the molecules. This creates light at wavelengths that corresponds to the difference between the energy levels. Since the energy levels are distinct, we get light at very specific wavelengths. These wavelengths get diffracted at different angles by the grating in the optical instrument. We can then use the diffraction of the light to identify different elements. Later in the class we will learn that due to the rules of quantum mechanics, bound states will exist only at certain energy levels. Since electrons are inside the potential well of the atom/molecule, they are in bound states and hence live only at the energy levels possible in the potential well. Since different elements have different nuclei, the electrons in each are exposed to different potential wells and hence exist at different energy levels. When we put energy into a gas (in this case by applying a voltage) we make it easier for electrons to be ejected from the atoms/molecules. When an electron is ejected, another electron will fall down from a higher shell to replace it. When the electron falls into the lower shell, it gives up some energy in the form of a photon. Since there are only a handful of populated energy levels, and since it is the difference in energy levels that determines the energy of the photons, each element/molecule will emit photons with elements characteristic to the element/molecule. Since the energy of the photon is proportional to its frequency, each one of these characteristic photons will also have a known wavelength. By identifying the wavelengths of emitted light, one can identify an element/molecule. We can put some numbers onto this...
The Hydrogen lines in Angstroms have the following wavelengths: 4102, 4340, 4861, 6563
These wavelengths correspond to an electron falling from the mth shell down
into the nth shell. In the Bohr model, the energy of a bound electron goes as n-2,
so E2 = -E/4 whereas E3= -E/9. The energies are negative because we are
discussing a bound system. We will also learn that the energy
of light is proportional to its frequency:
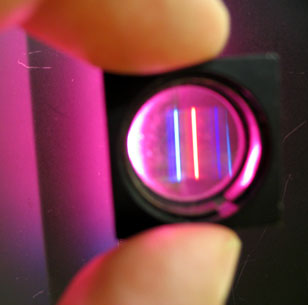
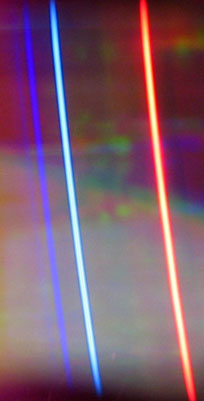
On one end of this experiment we investigate bound energy states, energy being emitted in the form of photons and the relationship between frequency and energy. The other end deals with light as a wave. A grating diffracts the incoming light into different angles. Whereas the idea of light having wavelengths relating to the energy levels in atoms/molecules is a "light as a particle" idea, diffraction is certainly a "light as a wave" concept. Hence we can get both views light. (And when I took photos for this lab, the light hit the CCD in my digital camera, and once again acted as a particle.)
The Experiment: 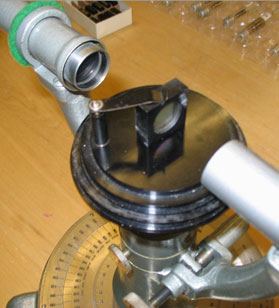
The diffraction grating should go in the middle of the instrument and be perpendicular to the tube with the slit on the end
Find the n=1 diffraction
lines for Hydrogen. Write down the angles you find them at and then
use those data to determine the spacing of the diffraction grating. It may be useful to
also collect second order (n=2) information for H. Always note the color of your lines,
this will help in your analysis later.
Remember
that the formula for diffraction from a grating is:
Helium lines in Angstroms - 3889, 4471, 4686. 4922, 5016, 5876, 6678, 7065
Once you have Hydrogen and Helium under your belt, start selecting
unknown gas tubes and recording at what angles you find them at. Pick either group A, B or
C and record data for the four tubes. Some of the tubes have many lines. To identify these, often
it is useful to note and record gaps in the spectra, and to write down only the brightest lines. Use
the NIST source (http://physics.nist.gov/cgi-bin/AtData/lines_form)
to help you identify the unknown gases. Note that you can limit the output to only the
strong intensity lines (you will only be able to see those lines). You will be
given a selection so that you can narrow your search.
Details of how you decided of how each spectra matched a given element are very important and
should form the core of your results and discussions section.
In this photo interstellar clouds glow pink, just like your one of your tubes. If an astronomer
looked at this spectrum, he or she would find the hydrogen lines, which combine to this color when
viewed by our eyes. Since we know exactly where the lines should be, we also know what their frequencies
should be. A very important tool in astrophysics is the use of the Doppler effect along with the known
frequencies of spectra lines - this tells us how fast an object is moving towards or away from Earth. 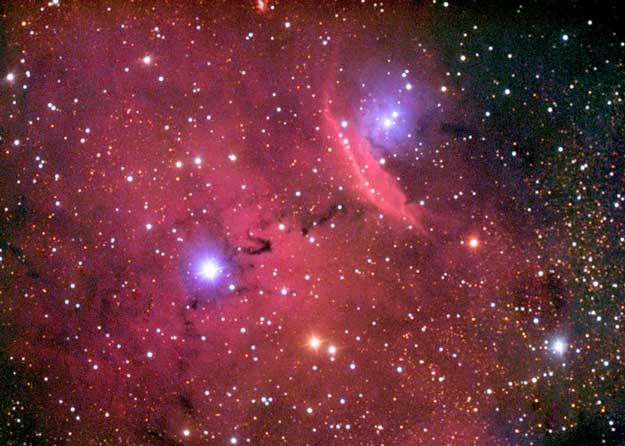
NGC 6559 |