Measurement of the Time Constant in an RC Circuit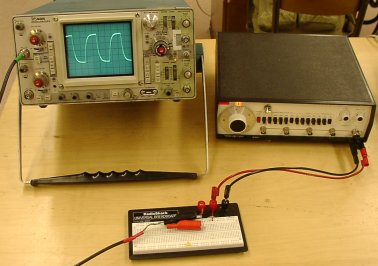
In this lab experiment we will measure the time constant τ of an RC circuit via
three different methods. In figure 1 we've sketched a series RC circuit. 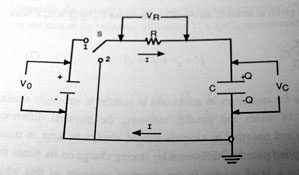
Figure 1 - Diagram of an RC Circuit When the switch is in position 1, the voltage source supplies a current to the resistor and the capacitor. Charge is deposited on the plates of the capacitor. At first there is very little charge on the plates, however, as time goes on the charge on the plates builds up and the increased voltage across the capacitor will reduce the flow of current through the circuit. We can see this in the following loop equation:
Vo + Vr + Vc = 0 As q gets larger, i must get smaller to compensate. As time goes on, the current will eventually approach zero. When the switch is moved to position 2, the battery is removed from the circuit, and the charge that has built up in the capacitor flows through the resistor. In this case the equation is:
iR + q/C = 0
This first order differential equation has a solution in the form of an exponential:
Where τ = RC. This decaying function is plotted in figure 2: 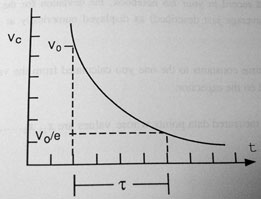
Figure 2 - Exponential Decay Given the values of R and C in most circuits, it is very hard to "watch" the decay. In this lab we will cheat a little bit, we will connect our RC circuit not to a voltage supply with a switch, but to a function generator that is outputting a square wave. This will act as an "on" and "off" voltage supply hundreds or thousands of times per second. We can then observe the voltage across the circuit on an oscilloscope, and measure τ from there.
Procedure: On your breadboard connect a capacitor and resistor in series. Pick a pair with an RC of 10-4 seconds or smaller. Note however that if you pick a capacitor with a very small capacitance, then the capacitance of the rest of the circuit will dominate your measurement of τ. If your results for method number #1 disagree strongly with methods #2 and #3, then you have ignored the warning about picking a very small capacitance.
Method #1
Method #2 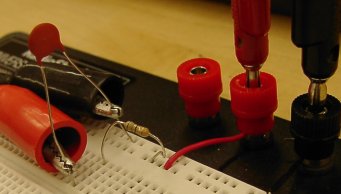
Figure 3 - Photo of RC Circuit
On your scope inspect the voltage across the capacitor. It should look something like Figure 4. Note that
you may have to adjust the triggering on your oscilloscope.
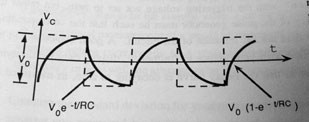 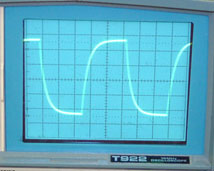
Figure 4 - Top: Diagram of Voltage Response Bottom: Voltage across the Capacitor on the Oscilloscope Extend the period of the function generator so that it looks like the capacitor is fully discharging. "Blow up" this section of the graph by changing the time scale, this way you can inspect it more closely. See Figure 5. 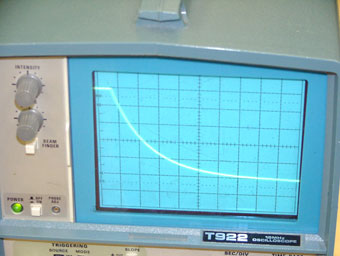
Figure 5 - "Blow Up" of the decaying part of the waveform Our second method of measuring the time constant will be a "one point" measurement. Since e-1 = 0.368, take the difference between the highest and lowest voltages, multiply this by 0.368, and add it to the lowest voltage. That will be the voltage across the capacitor after one τ. Find this voltage level on your screen and measure how long it took for the voltage across the capacitor to decay to this value. As voltage corresponds to one τ worth of decay, it is a direct measurement of τ. Remember to include an estimate of error in your notebook. Estimate the error the same way you would estimate the measurement error made when using a ruler.
Method #3 In your conclusion discuss the RC circuit, compare your values for τ with their uncertainties, and include your thoughts on the best way to measure τ. Note that you conclusion should be decently longer than ones you have written so far for this class, and that if your discussion does not include comments upon the uncertainties in your measurements, it will not be considered complete. |