 |
Lab Electronics for PhysicsIn this lab we will play with items that we'll be using in many lab experiments this quarter. Here is a quick list of the tools we will be using:
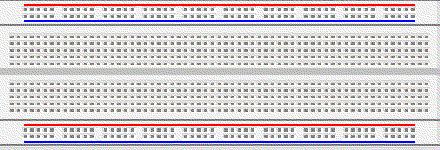
Breadboards  The breadboard in the diagram has a pair of lines of holes running between sets of red and blue stripes (yours will not have these colored stripes). These lines of holes are each at the same voltage, which means that any wire put into one of the holes is connected to any wires plugged into the same line. In the main body of the breadboard there are many columns of five holes. The same concept applies, each of those sets of five holes acts as a single voltage, so a wire plugged into one of those five holes is connected to any other wire plugged into one of the four remaining holes. This allows an experimenter to make connections between different parts of the circuit without soldering (and hence can build or modify the circuit painlessly).
Digital Multi-Meter (DMM)
Once you have measured three resistors and compared them to their stated values, experiment to find typical resistances for the human body. You can also break this down into finding the resistance of body parts. If your arm had a resistor code printed on it, what would it look like?
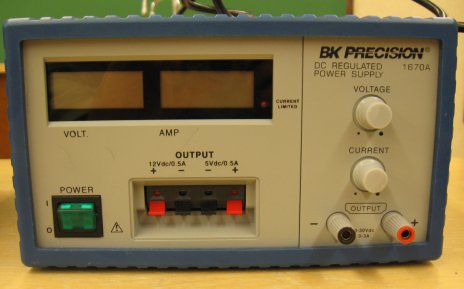
Low Voltage Power Supply  The next thing to do is to measure current. Connect your DMM and power supply to a resistor so that one wire goes from the power supply to the resistor. The other end of the resistor should be wired to the DMM, and to complete the circuit the DMM should have a return wire to the power supply. Before turning on power, make sure that your DMM is set to read current. Since you can read the voltage from the power supply, and know the value of the resistor, verify Ohm's Law, that V = i R. Note the we usually use 1/4-watt resistors in our labs. Later on we will learn that power is equal to i2R, or, substituting in from Ohm's Law, V2/R. This means that if V2/R > 1/4, you will fry your resistor.
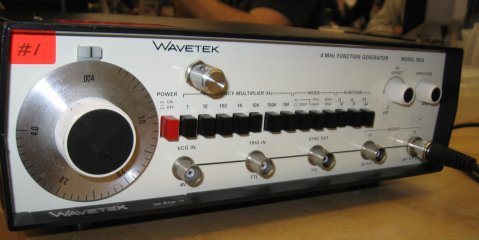
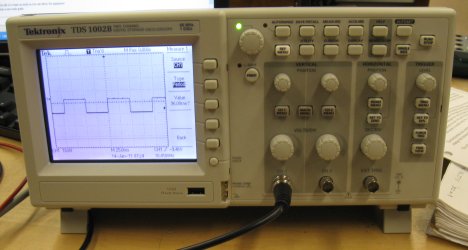
Function Generator and Oscilloscope  How would we actually see these wave functions? With an oscilloscope! In the dark ages, the use of an oscilloscope was as much an art as it was a science. Current technology makes the life of a student in lab much easier. After turning on the oscilloscope you will need to wait a minute or two for it to warm up. Once it is ready, hit the autoset button. The proper waveform will then appear on the screen (needless to say, in the old days one could not solve oscilloscope problems simply by hitting a magic button).  Now that you have the waveform displayed on your screen, play with the channel 1 volts/div knob. Note how it makes the displayed waveform bigger and smaller. It does not actually change the voltage of the signal (only a knob on the function generator could do that), but it changes the way the signal is displayed. For example, a 3-volt waveform displayed at one volt per division would be three divisions tall, but at two volts per division it would only be 1.5 divisions tall. The horizontal axis corresponds to time, and playing with that knob will allow you to change the timescale that is displayed. The triggering menu will be explained by the instructor. Note that there are some helpful buttons across the top of your oscilloscope. With analog scopes, it was often hard to judge exactly where a point on the waveform was. With a digital scope you can press the cursor button and know the exact coordinates for features on your waveform. You will use this feature many times in the coming weeks. The display menu allows you to monitor things like peak-to-peak voltage and the frequency of each wave form. There is also a help menu, which is very extensive. After playing with your oscilloscope, sketch a picture of a waveform from the function generator. Note to see if the period measured by the oscilloscope matches what you would expect from the settings on the function generator.
Note that this week's lab is graded on a pass/fail basis - the point of this lab is to learn as much as
you can about the equipment you will be using for the rest of the quarter, that's more important than
a one-week grade.
Pre-Lab: Simulated Oscilloscope Learning how to use an oscilloscope is an important step in an engineering student's career. However, they are expensive, and most people don't have access to them outside of lab. You can visit an online simulation to play with a fake oscilloscope. Before you go to lab, explore the online model. Write down the voltages and periods of the signals on the green, blue, tan and purple wires. Adjust the controls until you fill the screen with a sine wave, with the number of peaks close to the number of your birthmonth. Make the peaks take up the entire vertical size of the screen. Print this out. Can you make two different signals show up on the screen at the same time? Print this too. Note if you double-click on a control, it brings you to an informative screen that helps you understand that part of the oscilloscope. |