Induced Voltage from a Dropped Magnet
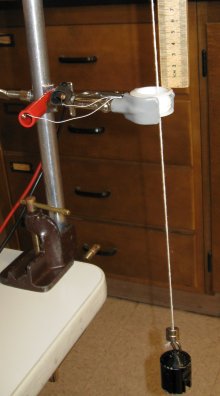
Build your measurement rig. An arm on the top should support a string. This string goes through a strong magnet, a detecting coil, and is held in tension by a weight. This arrangement allows you to drop the magnet through the coil. It is also handy to mount a ruler so you know the height of each drop. We'll use an oscilloscope to collect our data. Up to this point we haven't worried about triggering when we've used our oscilloscope, we've just let the machine automatically decide how to best operate. In this case we will be trying to capture single events, so we'll have to be a bit more careful with how the oscilloscope captures the signal.
Press the trigger button to bring up the proper menu. We'll want to set our options as follows: 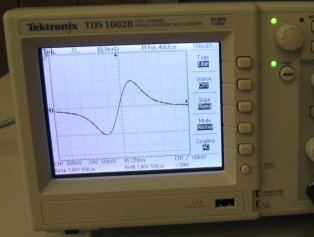
In your lab notebook, explain why the signal is shaped the way it is. Drop your magnet from six or seven different heights, exporting your data to a memory stick as you go. Import the data into Excel, and compare the peak-to-peak voltages to the calculated velocities (remembering your kinematics might be helpful here). What do you expect? What do you see?
Once you've made sense of the height of the voltages, concentrate on the total area under the curves.
If you are think about Riemann Sums, you are going down the right track. Actually, you want to sum the
absolute values. This is hard to do in Excel, but you can use the command
|
 We know from lecture that a changing magnetic field will create a voltage. In this week's
lab we will drop a magnet through a coil and use an oscilloscope to measure the signal.
We know from lecture that a changing magnetic field will create a voltage. In this week's
lab we will drop a magnet through a coil and use an oscilloscope to measure the signal.