In 1913 Niels Bohr introduced his model of the hydrogen atom. One of the predictions was that the electrons occupied only certain energy levels. This was in agreement with the observed spectrum, but physicists were eager to find another experiment that would also show this result. In 1914 James Franck and Gustav Hertz (nephew of Heinrich) performed an experiment on a vacuum tube with a small amount of mercury enclosed. The tube was heated in an oven in order to vaporize the mercury, and then a series of voltages was applied to the tube. A small voltage was used to heat a filament for use as an electron source. Three more voltages were used to establish electric fields inside the tube. The first field is a small field, it used in order sweep the electrons away from the filament. It is observed that when filaments eject electrons they become slightly positive, and the region around the filament becomes slightly negative due to the cloud of electrons. If a small field isn't put in place to draw the electrons away from the filament, it becomes hard to draw out more electrons. The second field is an accelerating field, this is what gives the electrons the bulk of their kinetic energy. This is usually called the grid voltage because it is established by a grid that the electrons can penetrate. Once the electrons go through the grid there is a reverse field that acts to retard electrons from the counter. If there is only vacuum in the tube then the grid voltage will accelerate electrons to the counter, and if the retarding voltage is less than the grid voltage a current will be detected. 
Diagram of Franck-Hertz Tube In the Franck-Hertz experiment the low-pressure mercury vapor affects the detected current. At low grid voltages the electrons gain kinetic energy. They collide with mercury atoms, but these are elastic collisions, and since electrons have such a smaller mass than mercury the electrons retain most of their kinetic energy. As the voltage increases, so does the current. However, once the electrons gain kinetic energy equal to the excitation energy of mercury they can have inelastic collisions - the kinetic energy of the electron exciting the mercury atom. If an electron with exactly the excitation energy had an inelastic collision, it would have a final velocity of zero. This is why the experiment also features a retarding field. Only electrons with a kinetic energy that can overcome the retarding field get counted in the current. As the grid voltage is increased to the excitation voltage, the current will drop because many of the filament electrons have lost their kinetic energy to inelastic collisions and cannot overcome the retarding field. If the observed current is plotted against voltage, the there will be a series of peaks and valleys. The peak-to-peak (or valley-to-valley) spacing will correspond to the excitation energy of the vapor (the multiple valleys are due to multiple inelastic collisions). 
Current Measurements in the Franck-Hertz Experiment Students who want to get a preview of the experiment can visit an online Franck-Hertz simulation. We'll do today's experiment using three different elements, argon, neon and mercury. Each element has its own apparatus. Each group should take data for every element. The people presenting today's topic are responsible for setting up the mercury tube. Fit your data for each of the elements. One method of checking results is to visit the NIST site we've used in this class previously. Note that many people find the difference between each peak (or valley) and then average these numbers. Why is this a bad idea? Instead, students should plot peak number on the x-axis and voltage on the y-axis and find a slope as usual. Repeat for valleys.
Argon 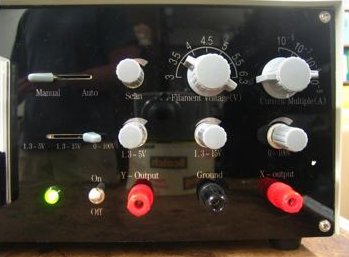
Front Panel of Argon Experiment On the top row of dials and switches, set the manual/auto switch to manual, the filament voltage dial to 3.5V and the current multiplier to 10-9. The second row of switches and dials controls the various voltages. Start with the switch positioned to the left. This first voltage (to sweep off electrons) should be roughly 1.5 volts. The middle position is for the retarding voltage, and should be set to 7.5 volts. Then move the switch to the right to control the grid (accelerating) voltage. Raise this voltage in two-volt increments and record the current. You will have to change the current multiplier during this experiment, and it is a good idea to measure in one-volt increments near peaks and valleys. Note that the system takes a while to settle after each change in voltage, so don't be too hasty in measurements. Plot the current as a function of voltage and determine the excitation energy of argon. Note that the current is given by the multiplied on the knob, ignore the mA label on the meter. If the current rises rapidly after about 60 volts, this may damage the tube. If you see this happening, do not attempt to collect data past the point of rapid current increase. When you are done taking data, remember to turn off your equipment. Since we are dealing with vacuum tubes, turn down the voltages slowly before shutting down. Neon The wiring is fairly straightforward. There are five banana-plug connections from the instrument box to the tube, all color-coded. In addition, a BNC cable runs from the top of the tube to a connector on the upper-left-hand panel. The output in located on the upper-right-hand panel and needs to be connected to an oscilloscope. Take ground and X and measure them on channel one, and ground and Y and measure them on channel two. Some versions only have four banana-plug connections, these tubes still perform well. this 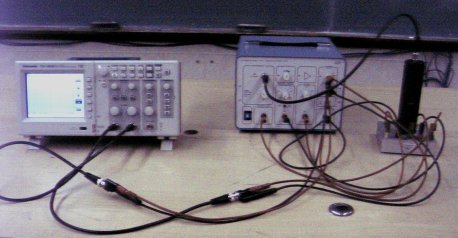
Neon Franck-Hertz Equipment The oscilloscope needs to be put into XY mode. Normally an oscilloscope will display voltage on the Y axis while it sweeps time across the X axis. In XY mode the oscilloscope puts the voltage measured on channel one on the X axis and puts the voltage measured on channel two on the Y axis. To put your oscilloscope into XY mode, press the Display button and then the Format sidemenu button until it reads XY. There are five user-controlled inputs on your instrument panel. One of them is a switch. At the start of the experiment you should switch this to RAMP/60Hz. There are four dials. Reverse Bias should be set to roughly 4 volts and not adjusted. This is the retarding voltage. The filament voltage should be set to 8 volts. Look inside the tube, if you cannot see the filament glowing a dull orange, the voltage is too low. If it is bright, it is probably too high. You will most likely have to fine-tune your filament voltage setting during the experiment. After the filament has warmed up, set the accelerating voltage to 70 volts. The last knob, labelled amplitude, actually adjusts the gain on an amplifier. The current created by the filament is so small that it needs to be boosted to be seen on the oscilloscope. The filament voltage and amplitude knobs will have to be carefully balanced to see the proper waveform on your oscilloscope. 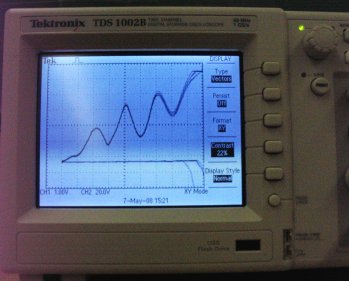
Output on the Oscilloscope Screen (Note that the last peak has saturated the amplifier) Once you have the proper waveform, you will want to save your data to USB (you did remember to bring a USB memory device smaller than 1G to lab, right?). Normally to do this you would hint the Print button (first you might check the settings by using the Save/Recall button - make sure your oscilloscope is set to "save all"). However, saving data is an option that is not available in the XY display mode. We can overcome this problem by putting the oscilloscope back into the YT display mode and then saving. Note that you will have to see two waveforms (channels one and two) on your screen for both to be saved. You can then take Excel, combine the two data files via cut and paste, and then graph your results. Once you have saved your data, bring the accelerating voltage back down to zero and turn the switch to manual. Announce that you are going to turn off the room lights, and then do so. Slowly turn up the accelerating voltage. As you go through the first minimum in current, an orange blob will move down the tube. This is due to the fact that the transition has an energy spacing with a wavelength in the optical region. Once the electrons leave the filament they pick up energy from the accelerating voltage until they reach the speed where they have enough kinetic energy to interact with the neon atoms. As the accelerating voltage is increased, this kinetic energy is gained over a smaller distance, which is why the blob moves down the tube (towards the filament). Once the second minimum is reached, you should see two blobs. Electrons pick up enough kineitc energy to interact with the neon, and after travelling farther along the tube, again pick up enough energy to have a second interaction. This is one of the few visual confirmation you'll ever get of atomic theory, make sure that you see it. 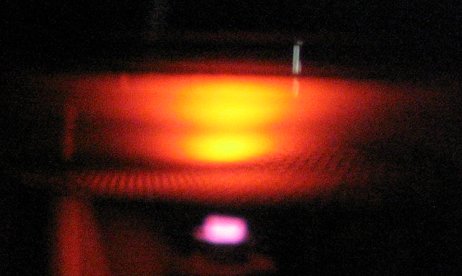
The First Three Neon Excitations (The second and third excitations are hard to distinguish in this photo) Mercury
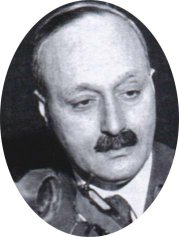
"It might interest you to know that when we made the experiments that we did not know Bohr's theory.
We had neither read nor heard about it. We had not read it because we were negligent to read the
literature well enough -- and you know how that happens. On the other hand, one would think that other people
would have told us about it. For instance, we had a colloquium at that time in Berlin
at which all the important papers were discussed.
Nobody discussed Bohr's theory. Why not?
The reasons is that fifty years ago, one was so convinced
that nobody would, with the state of knowledge
we had at that time, understand spectral line emission,
so that if somebody published a paper about it,
one assumed, "Probably it is not right."
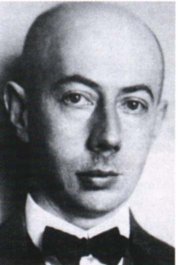
So we did not know it. But we made that experiment (and got the result
that confirmed Bohr's theory) because we hoped that if we found out where the
borderline between elastic and inelastic impact lies... only one line might appear.
But we did not know whether that would be so, and we did not know whether at all an emission
of an atom is of such a type that one line alone can be emitted and all the energy can
be used for that purpose. The experiment gave it to us,
and we were surprised about it. But we were not surprised after we read
Bohr's paper later, after our publication."
Possible Quiz Questions 1. What three gases will we use today? 2. Why does the mercury experiment need an oven? 3. What are the safety warnings for this experiment? 4. Why do you see multiple peaks and valleys in the Voltage-Current graph? 5. What are the three voltages in the experiment, and what do they do? 6. Explain the meaning of the orange blobs in the neon tube. 7. What did Franck and Hertz know about Bohr's theory when they did the experiment? 8. Draw and label a circuit diagram of the Franck-Hertz tube. 9. What does the distance between the peaks (or valleys) represent? 10. Some people take the average of the differences between valley voltages, what's a better method? |